Uncategorized September 27, 2022

February ’22 Market Watch

February, 2022

 Mortgage Rates Are The Story

    Readers of Market Watch were aware that mortgage rates would increase over the course of 2022. In last month’s Market Watch it was noted that “Many economists expect mortgage rates to rise this year after the Federal Reserve announced last month that it would begin dialing back its monthly bond purchases, which was intended to lower long term rates to help slow accelerating inflation. In addition, experts expect continuing economic growth and the tight labor market to continue to push rates higher.” The conclusion was that rates to reach 3.5 percent by the third quarter and up to 3.7 percent by the end of the year.

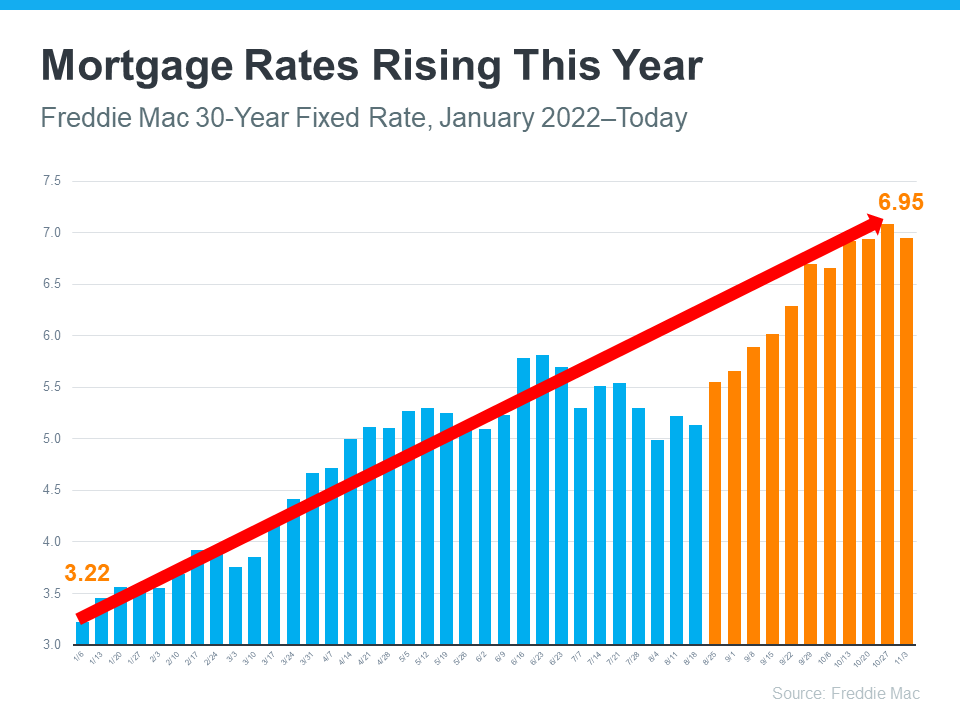
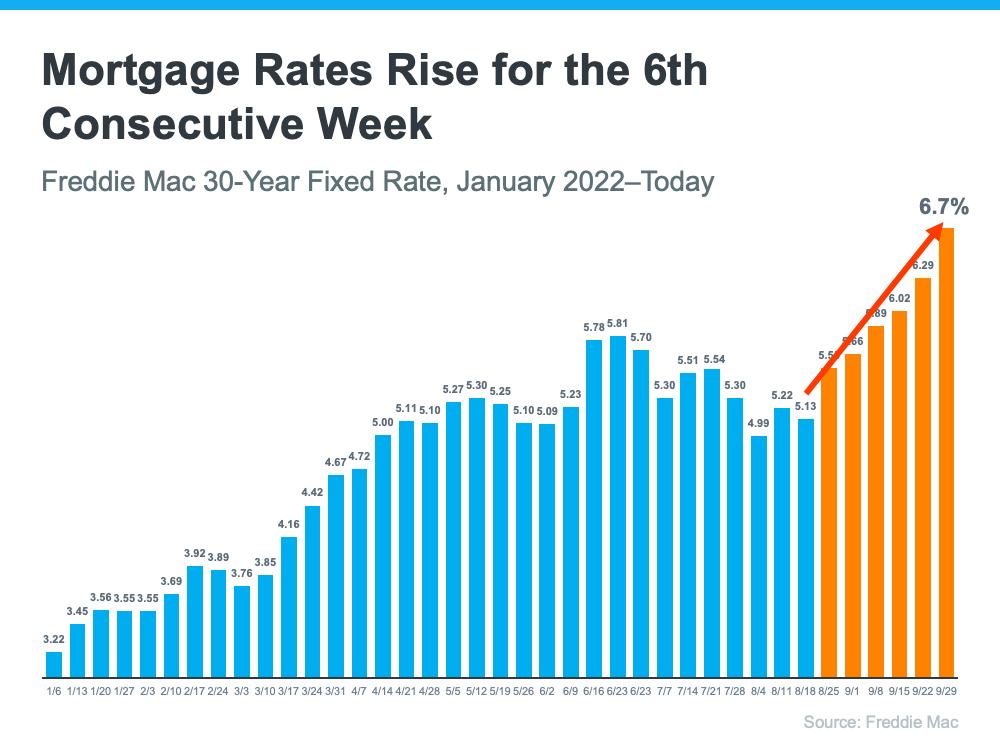
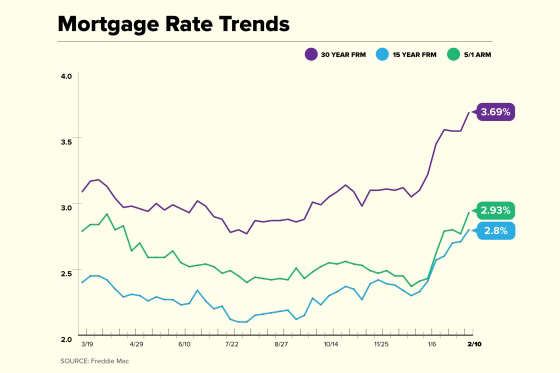
Well, mortgage rates did rise this past week, but well above forecasts. In fact, rates just had the largest one month jump since 2013. According to Freddie Mac, whose mission is to promote stability and affordability in the housing market by purchasing mortgages from banks and other loan makers, rates for a 30 year fixed mortgage had jumped from 3.11 percent at the end of December to 3.55 percent on February 3, and to 3.69 percent, with 0.8 points paid, one week later. The average rate was 2.73 percent at this time last year.

The rate for a 15 year mortgage also saw a significant increase. Rates increased by 0.16 percentage points during the February period, hitting 2.71 percent, with 0,8 points paid, on February 10. The average rate was 2.19 percent during the same time period last year.

The situation is more hard hitting if points are taken out of the equation. In that case, rates are being quoted as high as 4.02 percent.

The upward pressure is likely to continue. The consumer price index, released on the February 10, showed that inflation increased to 7.5 percent compared to the 7.2 percent estimate from market observers. That is the highest rate of inflation since 1982. As a result, Treasury yields are rising, and if that continues mortgage rates will follow.

Will the rise in rates shake up the home buying market? Because of the high demand for homes, and the very low inventory, the market should not significantly suffer. Affordability will become an issue for some buyers. And some may drop out. Take a $500,000 home purchase with $100,000 down, a 30 year fixed rate mortgage at 3.0 percent is $1,686 (not including taxes etc.). At 3.69 percent, the payment jumps to $1,839, a $153 monthly difference.

Not only could that higher monthly payment scare off some would be buyers, it will also lock some buyers out of the market. That is because banks and other lenders issue mortgages based on strict debt-to-income ratios, which include the mortgage being applied for. That means that each time mortgage rates increase, even by a small amount, some buyers lose their mortgage eligibility.


Uncategorized September 27, 2022

March ’22 Market Watch

March, 2022

 What Will Home Prices Will Look Like In 2023?  According To Fannie Mae

     Heading into 2022, the consensus of analysts covering the real estate market was that home price growth would decelerate significantly during this year. But in two months, what a difference. Already some of the same firms that projected this deceleration are backing off their forecasts. Zillow, for example, forecasted that price growth would decelerate to 11 percent  this year, from the December 2020 to December 2021 growth of 18.8 percent. Well, during February, the company revised that growth rate back up to 17.3 percent.

And Zillow isn’t alone. Fannie Mae, a leading source of mortgage financing in the U.S., just became the latest real estate firm to up their 2022 forecast. During 2021, Fannie Mae predicted that the median existing home price would climb 7.9 percent during 2022. Now, the company believes that the median existing home price in 2022 will jump from $355,000 to $384,000; an increase of 11.2 percent, year over year. (This is a national number, the price increase will vary from state to state and locale to locale).

Granted, if home prices do rise another 11.2 percent, it would indeed mark a deceleration from the 18.8 percent growth noted above. However, that would hardly represent relief for home buyers who have witnessed this unprecedented surge in prices. After all, the typical raise that corporate America plans to dole out this year is only 3.9 percent.

According to Fannie Mae, relief may be on the way. But not this year. Buyers will have to wait till 2023 when home prices are projected to rise by 4.2 percent, with the median existing home price increasing to $395,000 (See Graph, Fortune).

Why are 2022 forecasts suddenly getting revised upward? Readers of Market Watch probably know the answer, and those trying to purchase a new home are living it. The answer is the lack of available homes for sale.

For much of the past 24 months, the underlying issue in the housing market has been a lack of inventory. And it is continuing. Last month, Bridgewater had just .86 months of available homes, Branchburg 1.73 and Hillsborough 1.31. With a wave of first-time millennial home buyers, coupled with low mortgage rates, available homes are still being gobbled up quickly, keeping inventory extremely tight. Forecasters had believed that this problem would abate this year. But it hasn’t.

Fannie Mae believes this should change next year. Already, mortgage rates are rising and hovering around 4 percent. And the Federal Reserve is hinting at rate increases. Rising mortgage rates cause monthly payments on new mortgages to rise as well. Higher mortgage rates, coupled with the increase in home prices over the past months, should pressure more buyers to rethink their plans. When that happens, home price growth could finally begin to normalize. Again, that is what Fannie Mae believes. “The effect of buyers being priced out should mean fewer bidding wars and slower house price appreciation,” wrote Fannie Mae economists in their latest outlook.

(Information and the chart for this section is credited to Fortune)


Two Important “Concepts” When Analyzing Demand In the Housing Market


Readers of Market Watch may be acquainted with these concepts. They have been presented in several of the past issues of Market Watch when discussing supply, demand and the rise of mortgage rates in the housing market. But considering the continued tight market and the Feds apparent willingness to push rates up, it may be a good idea to reintroduce these rules.

The first is the month’s supply of available homes. Months’ supply refers to the number of months it would take for the current inventory of homes on the market to sell given the current sales pace. The lower the number means the lower number of homes available; the higher the number, the higher amount. It also would indicate whether the market favors sellers or buyers. Numbers ranging from 0 to 4 would indicate a seller’s market, since the inventory of homes is low and cannot satisfy buyer demand. Numbers above 6 would indicate a buyer’s market where the supply homes is high, surpassing demand, and favoring buyers. When the number is 5 to 6, it is basically a neutral market where neither sellers or buyers are favored.

Right now, Bridgewater’s number is .86, Branchburg’s 1.73 and Hillsborough’s 1.31. These numbers indicate that supply is not close to meeting demand and that sellers are favored in these areas, and should be for sometime.

The second concept has to do with the effect of a rise in mortgage rates on buyer affordability. The concept is that a one point rise in mortgage rates decreases affordability by approximately 10 percent. For example. If a buyer can afford, based on income and liabilities, a $500,000 home at a mortgage rate of 3 percent, and the rate climbs to 4 percent, the home buyer can only afford a $450,000 home. A significant difference that could decrease demand. Of course, this is a general rule, and affordability can be influenced by many other factors. But this is a good guide when examining how a rise in mortgage rates can change demand for housing.


Just A reminder Regarding Home Insurance


    As you are probably aware, home values have soared over the past two years. As such, it is important to take a look at your homeowner’s insurance to see if you are adequately covered in case of a loss. The question to ask is, can I fix or even rebuild my house based on current material and labor costs which have also increased? And, am I in a position to cover living expenses during the time it takes to do the rebuild?

It may be a good idea to reach out to your homeowner’s insurance representative and have that discussion. Have them review your current policy and give you recommendations on any gaps, discounts, or improvements that can be made to your existing coverage.

To have a beneficial conversation with your insurance representative, you are probably going to need the current value of your home. As your local realtor, I can easily provide that number by conducting a competitive market analysis.

This simple exercise can provide you with the peace of mind knowing that you are properly covered in the event a disaster strikes.


Al Fross is a Coldwell Banker Realty Sales Associate based in the Bedminster/Bridgewater office. Al has lived in the Bradley Gardens section of Bridgewater since 1993 and has been an active volunteer in many recreational and community organizations including serving as the past Chairman of the Township’s Planning Board and past member of Bridgewater’s Board of Adjustment. His knowledge of the Bridgewater and surrounding areas makes him the perfect “partner” when selling your existing property or buying your new home.


Uncategorized September 27, 2022

May ’22 Market Watch

May, 2022

 The Question: Is The Housing Market In A Bubble?

(Charts courtesy of Keeping Current Matters)

     The one question that is constantly being asked, and one that is making news stories, is, is the housing market in a bubble and are home prices going to fall? And it is a good question. Afterall, home prices are higher than they have ever been, and they show no signs of stopping, even with the recent increase in mortgage rates. The median U.S. home listing price was $405,000 in March 2022, the first time it has broke the $400,000 price threshold, according to data from Realtor.com.

Locally in Bridgewater, the average listing price at the end of 2021 was $599,786 (condo, town home, single family). Going into May, the average listing price of a Bridgewater home increased to $649,875. Similarly, the median listing price at the end of 2021 was $510,000. As of the end of April, the median listing price was $581,573.

With these increases homebuyers might see similarities between what is happening today and the 2006 housing market where home prices became increasingly unaffordable until the bubble burst. Buyers might be thinking, or hoping, that these prices are a bubble just waiting to pop again. In fact, according to a recent Redfin Survey, a real estate brokerage, 77 percent of homebuyers believe there is a bubble where they live.

Well, for those not wanting to read further, the answer is No. The market is not in a bubble environment and, according to the experts, prices will not tumble.

Today’s market differs significantly from what happened 15 years ago. Prices at that time were driven by loose lending practices and rampant investor speculation (false demand) in the market. During that time, a buyer could get a mortgage with little verification of their financial position. In addition, cash out refinances were way too popular  with home owners. Home owners took the equity they had, cashed it out, bought expensive personal items or vacations thinking loose lending practices would last forever. When lending practices tightened, problems for these owners grew. A lot of bad borrowing and predatory lending was a significant reason for the housing bubble.

How have lending practices changed? The accompanying graph shows the amount of loans approved to people with a credit score less than 620. As indicated, the highest volume of these loans were right before 2008.  Where do we stand as the third quarter of 2021 (latest available Fed data)? A fraction of where we were back then. So, one of the major contributors to the burst in 2008 is not around any longer.

Another argument for a bursting of a bubble is affordability. With home prices escalating and mortgage rates increasing, people are not going to be able to afford housing. And on the surface, the argument  appears sound.

A change in mortgage rate does have a significant impact on affordability. The chart below shows the impact. The chart goes back to January 2021 when the rate was 2.73 percent. Based on a loan amount of $300,000, the payment of principle and interest would be approximately $1,221. Fast forward to where mortgage rates are likely to be, around 5.5 percent, the payment jumps to just over $1,700, roughly a $500 difference. Couple that with increases on other items due to inflation and the pressure on buyers is real.

However, looking at the Housing Affordability Index by the National Association of Realtors (NAR), affordability is really approaching more historical levels. It goes all the way back to 1990 and graphs affordability. The higher the bar, the more affordable homes are. As the graph shows, homes are not currently as affordable as they were over the past several years, and certainly not as affordable as they were during the housing crisis. Rising mortgage rates and home prices have taken their toll on affordability.

But affordability is really a measure of three key variables. Those are home prices, mortgage rates and one other important variable, wages. All three are ticking up, but over the past couple of years, mortgage rates have offset some of the rising prices. That ship has sailed, and buyers are feeling affordability challenges.

But the graph also indicates that homes are more affordable than any time leading up to the housing crisis. So, the question to be asked about affordability is, compared to when?

Other factors suggesting that a bubble is not imminent are the strong seller’s market, the shortage of available homes for buyers, and pent-up demand. Right now in Somerset County there is only a 1.87 month’s supply of available homes (a 5 to 6 month’s supply is considered neutral). Locally, Bridgewater has a 1.33 month’s supply, Branchburg 1.31 month’s supply and Hillsborough 2.14. There is not enough homes on the market to meet buyer demand. Thus, homes that do go on the market, do not remain there long. Buyers flock to newly listed homes. It is not uncommon to see a line of buyers waiting at an open house. This demand normally results in multiple offers and at above listing prices. From the time a home is listed, till the time it is under contract is very short. In Bridgewater that time is now 25 days, Branchburg 15 and Hillsborough 19 days.

And demand is strong. Right now millennials, a very large generation that are in their 30s, are now married with children. Apartments aren’t working any longer and they are looking at houses. Additionally, the pandemic has made remote and hybrid work a possibility. That means being close to an office is not a priority and more space is needed for an office. Remote work means owning a home is a option for more people.

One interesting question is why the shortage of homes? One significant reason is that with the prices of homes and raising rates, existing homeowners rather remain in their homes than move. High home prices might seem to encourage people to sell, but most would have to buy another home and face the same market as buyers, high prices, higher mortgage rates (many have refinanced at lower rates) and low supply. A survey by Discover Home Loans found that 79 percent of homeowners would rather renovate their home than move.

The bottom line is that even with higher prices, and mortgage rates, until supply catches up to demand, a bubble does not exist to burst. Some buyers will drop out but there are still plenty pent-up demand to fill any void. Pricing may not increase at the level of prior years, but it will not drop until supply and demand are more evenly matched.

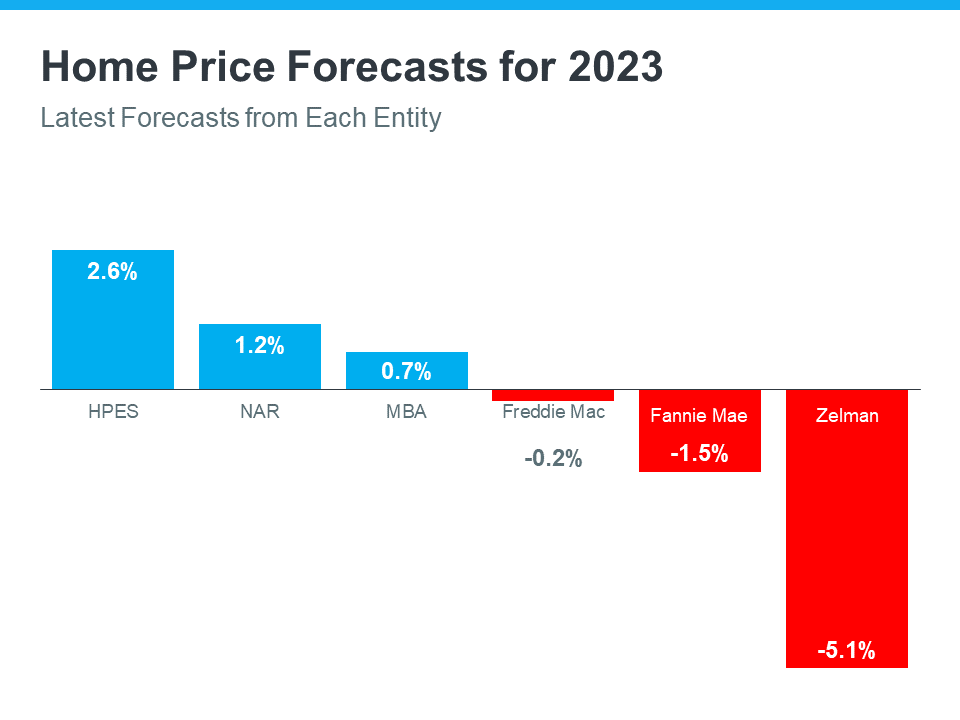
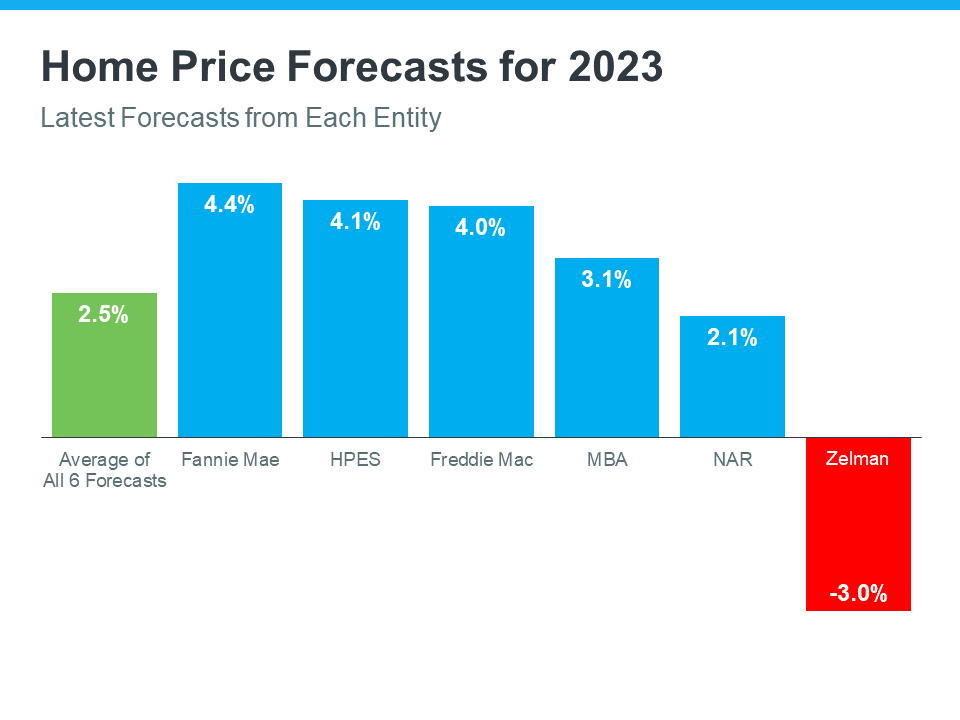
Now for the second question. By how much will prices increase? Experts suggest that the housing market will not see a price decline due to the imbalance of supply and demand. As the chart indicates, all are forecasting price increases for 2022, with an average of 9 percent. Well below prior years, but still strong.

For buyers waiting for price depreciation, not likely. Waiting will actually cost you more because of climbing mortgage rates and rising home prices.


Uncategorized September 27, 2022

July ’22 Market Watch

July, 2022


Recession And Mortgage Rates – A Historical Perspective


There is growing concerning by the business and consumer sectors that a recession is likely. Those concerns were confirmed when the Federal Reserve increased interest rates in their attempt to bring down inflation. Their hike of .75 percent points put the Fed funds rate upwards to 1.75 percent. Mortgage rates responded in kind, and as of July 14 stood at around 5.5 percent for a 30 year conventional mortgage.

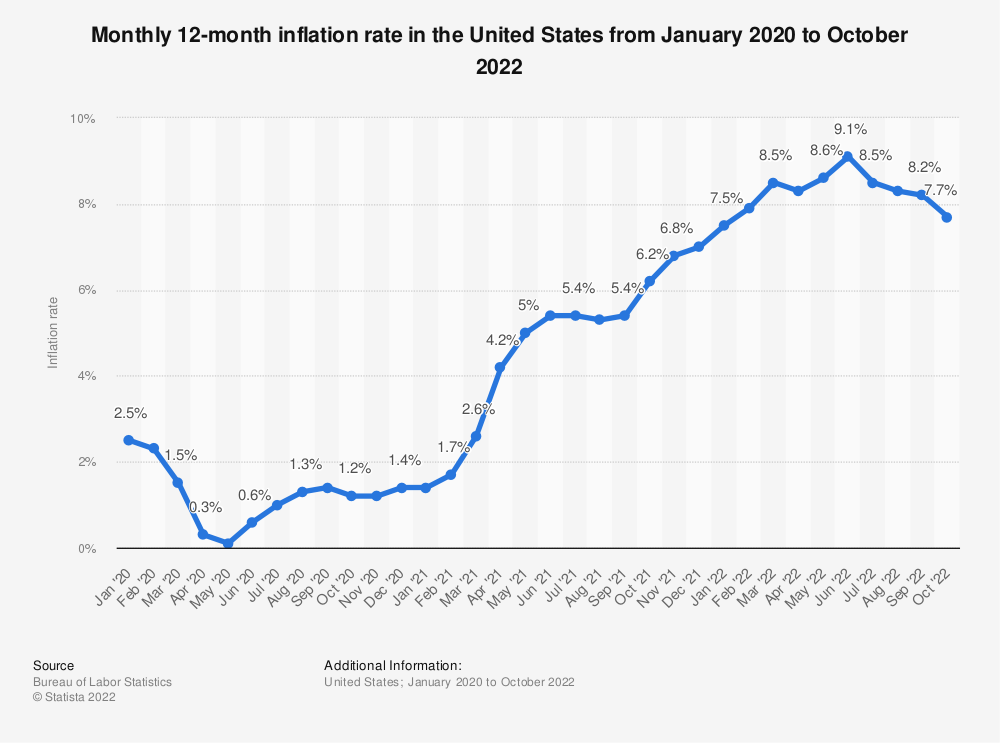
The Federal Reserve will likely raise their rate during their July meeting. Some analysts suggest up to another .75 percentage points. During June, inflation jumped again on a persistent climb in gas, food and rent costs, notching another 40 year high. Prices increased 9.1 percent from a year earlier, up from an annual rate of 8.6 percent the prior month and the largest gain since November 1981. If the Fed does raise rates in an attempt to curb inflation, as anticipated, the likelihood of the economy slowing further increases, and into a recessionary period.

Now for a historical look. Throughout history, during the early stages of a high inflationary period, the Federal Reserve raises rates and continues to do so thru the beginning of a recession trying to tame inflation and engineer the “soft landing”, as they are hoping to do now. If they miss that target, the economy heads to a recession, which according to analysts, is highly likely.

The Federal Reserve raising rates will most likely force an increase in mortgage rates. Where to? Probably somewhere just over the 6 percent range further slowing home purchases and price appreciation. That will be very bad for the economy because of the tremendous impact the real estate market has on economy, not just in home sales but also subsequent purchases such as furniture, décor etc.

So, historically what happened when the economy finds itself in a recessionary period? Once recognized by the Fed (note: the Fed works on past data) rates will be pulled back and mortgage rates will fall. Over the past six recessions, mortgage rates have fallen an average of 1.8 percentage points, with some dropping considerably more, from the peak of the recession to the trough. And in many cases they continued to fall after the fact, since it takes some time to turn the economy around. It is often said that housing will lead the economy out of a recession. And historically it has. The economy will not recover until housing leads the way out. Housing has that much impact on the economy.

During the 1980 recession, from January 1980 to July 1980, rates fell from 16 percent down to 11.8 percent. After the July 1990 recession which lasted to March 1991 rates again dropped from 11 percent to 8.8 percent. During the early 2000 recession which lasted from March 2001 to November 2001, rates rose to 7.4 percent only to drop to 6.8 percent. And during the great recession, from December 2007 to June 2009, lasting 18 months, rates increased to 6 percent only to drop afterwards to 4.9 percent.

Hopefully, history will repeat itself and rates will again fall and help both the buyers and sellers in the real estate market.