May, 2022
The Question: Is The Housing Market In A Bubble?
(Charts courtesy of Keeping Current Matters)
The one question that is constantly being asked, and one that is making news stories, is, is the housing market in a bubble and are home prices going to fall? And it is a good question. Afterall, home prices are higher than they have ever been, and they show no signs of stopping, even with the recent increase in mortgage rates. The median U.S. home listing price was $405,000 in March 2022, the first time it has broke the $400,000 price threshold, according to data from Realtor.com.
Locally in Bridgewater, the average listing price at the end of 2021 was $599,786 (condo, town home, single family). Going into May, the average listing price of a Bridgewater home increased to $649,875. Similarly, the median listing price at the end of 2021 was $510,000. As of the end of April, the median listing price was $581,573.
With these increases homebuyers might see similarities between what is happening today and the 2006 housing market where home prices became increasingly unaffordable until the bubble burst. Buyers might be thinking, or hoping, that these prices are a bubble just waiting to pop again. In fact, according to a recent Redfin Survey, a real estate brokerage, 77 percent of homebuyers believe there is a bubble where they live.
Well, for those not wanting to read further, the answer is No. The market is not in a bubble environment and, according to the experts, prices will not tumble.
Today’s market differs significantly from what happened 15 years ago. Prices at that time were driven by loose lending practices and rampant investor speculation (false demand) in the market. During that time, a buyer could get a mortgage with little verification of their financial position. In addition, cash out refinances were way too popular with home owners. Home owners took the equity they had, cashed it out, bought expensive personal items or vacations thinking loose lending practices would last forever. When lending practices tightened, problems for these owners grew. A lot of bad borrowing and predatory lending was a significant reason for the housing bubble.
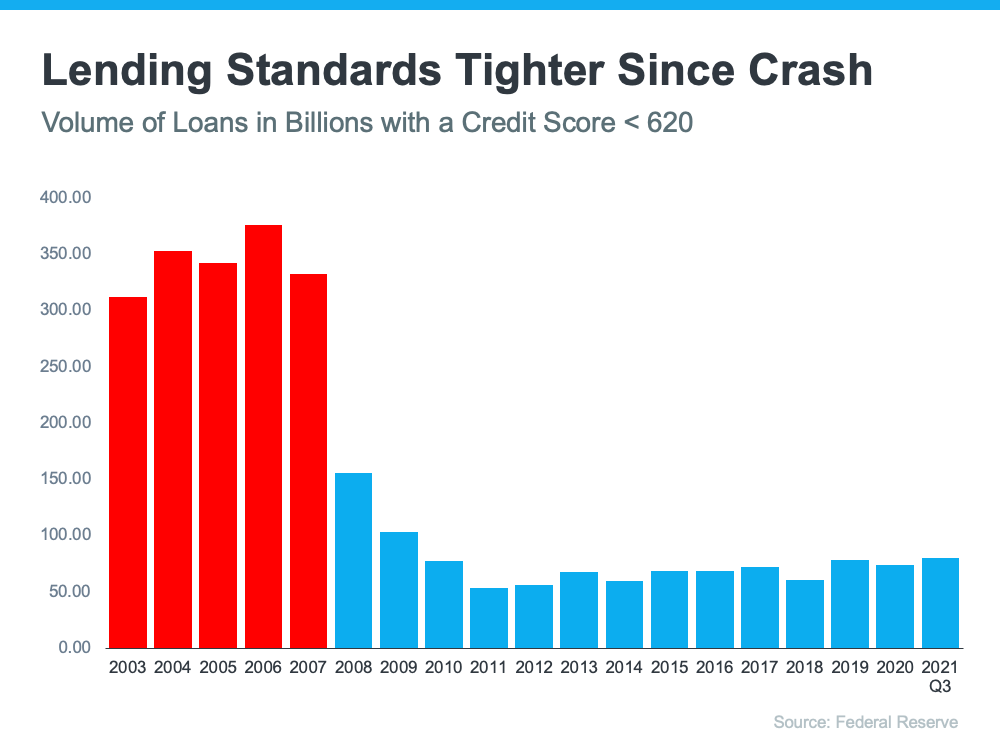
How have lending practices changed? The accompanying graph shows the amount of loans approved to people with a credit score less than 620. As indicated, the highest volume of these loans were right before 2008. Where do we stand as the third quarter of 2021 (latest available Fed data)? A fraction of where we were back then. So, one of the major contributors to the burst in 2008 is not around any longer.
Another argument for a bursting of a bubble is affordability. With home prices escalating and mortgage rates increasing, people are not going to be able to afford housing. And on the surface, the argument appears sound.
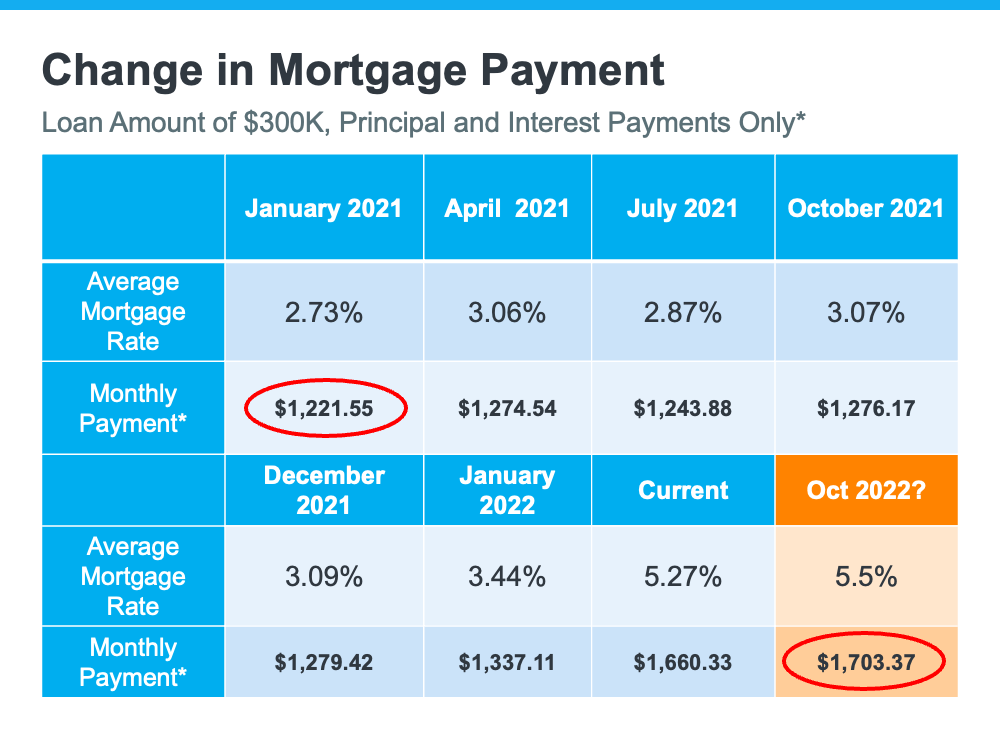
A change in mortgage rate does have a significant impact on affordability. The chart below shows the impact. The chart goes back to January 2021 when the rate was 2.73 percent. Based on a loan amount of $300,000, the payment of principle and interest would be approximately $1,221. Fast forward to where mortgage rates are likely to be, around 5.5 percent, the payment jumps to just over $1,700, roughly a $500 difference. Couple that with increases on other items due to inflation and the pressure on buyers is real.
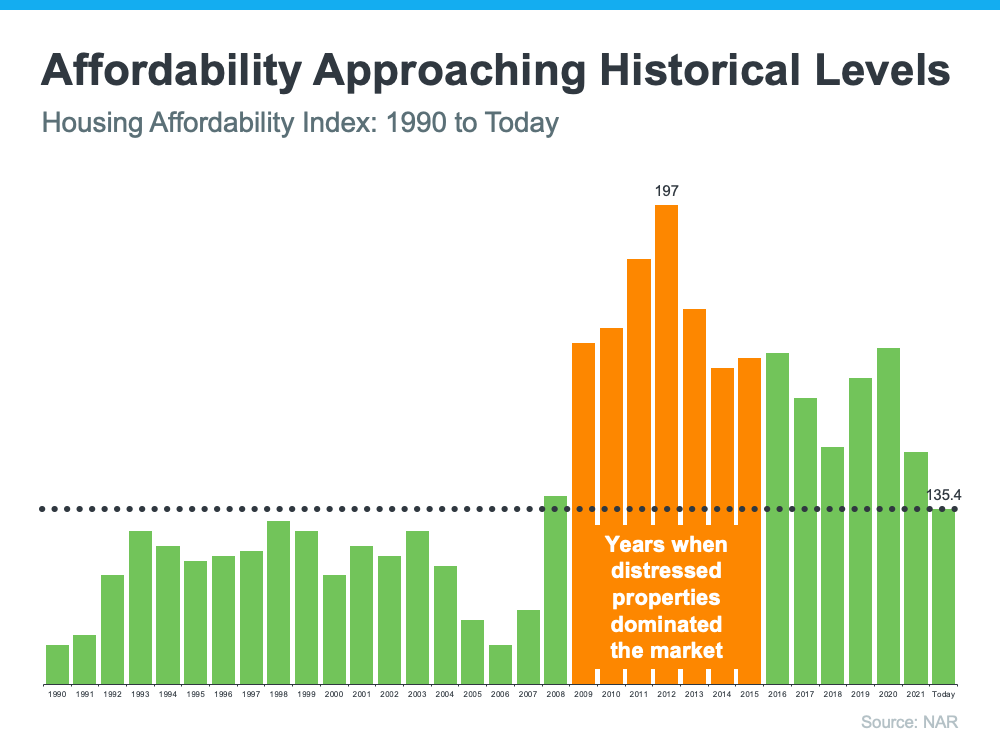
However, looking at the Housing Affordability Index by the National Association of Realtors (NAR), affordability is really approaching more historical levels. It goes all the way back to 1990 and graphs affordability. The higher the bar, the more affordable homes are. As the graph shows, homes are not currently as affordable as they were over the past several years, and certainly not as affordable as they were during the housing crisis. Rising mortgage rates and home prices have taken their toll on affordability.
But affordability is really a measure of three key variables. Those are home prices, mortgage rates and one other important variable, wages. All three are ticking up, but over the past couple of years, mortgage rates have offset some of the rising prices. That ship has sailed, and buyers are feeling affordability challenges.
But the graph also indicates that homes are more affordable than any time leading up to the housing crisis. So, the question to be asked about affordability is, compared to when?
Other factors suggesting that a bubble is not imminent are the strong seller’s market, the shortage of available homes for buyers, and pent-up demand. Right now in Somerset County there is only a 1.87 month’s supply of available homes (a 5 to 6 month’s supply is considered neutral). Locally, Bridgewater has a 1.33 month’s supply, Branchburg 1.31 month’s supply and Hillsborough 2.14. There is not enough homes on the market to meet buyer demand. Thus, homes that do go on the market, do not remain there long. Buyers flock to newly listed homes. It is not uncommon to see a line of buyers waiting at an open house. This demand normally results in multiple offers and at above listing prices. From the time a home is listed, till the time it is under contract is very short. In Bridgewater that time is now 25 days, Branchburg 15 and Hillsborough 19 days.
And demand is strong. Right now millennials, a very large generation that are in their 30s, are now married with children. Apartments aren’t working any longer and they are looking at houses. Additionally, the pandemic has made remote and hybrid work a possibility. That means being close to an office is not a priority and more space is needed for an office. Remote work means owning a home is a option for more people.
One interesting question is why the shortage of homes? One significant reason is that with the prices of homes and raising rates, existing homeowners rather remain in their homes than move. High home prices might seem to encourage people to sell, but most would have to buy another home and face the same market as buyers, high prices, higher mortgage rates (many have refinanced at lower rates) and low supply. A survey by Discover Home Loans found that 79 percent of homeowners would rather renovate their home than move.
The bottom line is that even with higher prices, and mortgage rates, until supply catches up to demand, a bubble does not exist to burst. Some buyers will drop out but there are still plenty pent-up demand to fill any void. Pricing may not increase at the level of prior years, but it will not drop until supply and demand are more evenly matched.
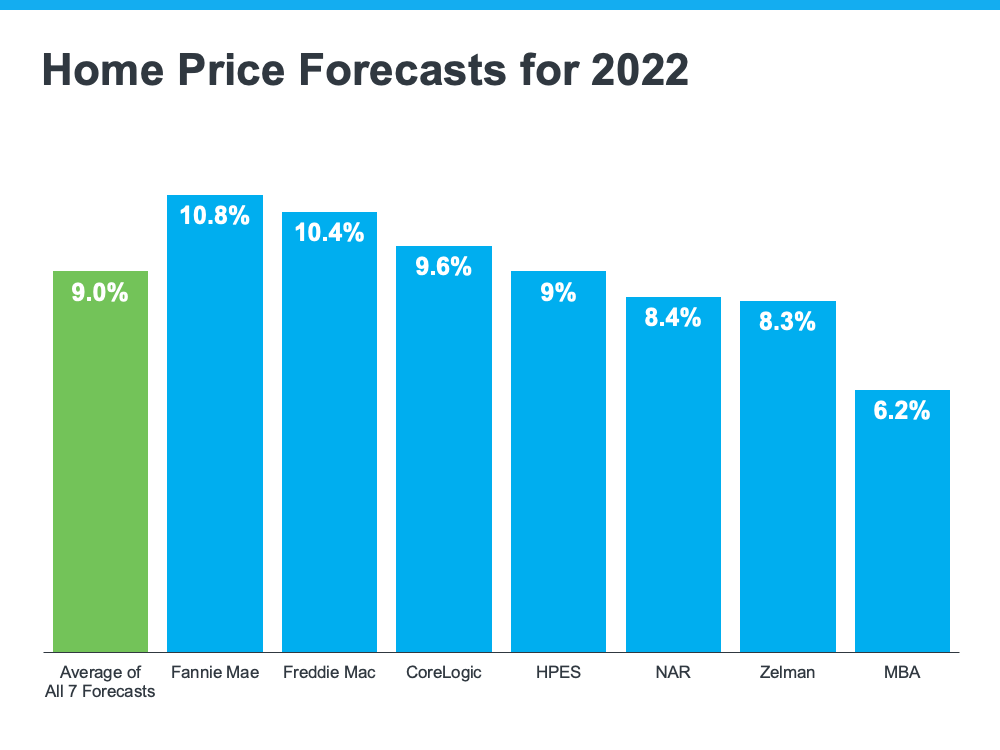
Now for the second question. By how much will prices increase? Experts suggest that the housing market will not see a price decline due to the imbalance of supply and demand. As the chart indicates, all are forecasting price increases for 2022, with an average of 9 percent. Well below prior years, but still strong.
For buyers waiting for price depreciation, not likely. Waiting will actually cost you more because of climbing mortgage rates and rising home prices.


 Facebook
 X
X
 Pinterest
 Copy Link


